GitLab Duo experiments
The following GitLab Duo features are experiments.
Forecast deployment frequency with Value Stream Forecasting
DETAILS: Tier: GitLab.com and Self-managed: For a limited time, Ultimate. In the future, Ultimate with GitLab Duo Enterprise. GitLab Dedicated: GitLab Duo Enterprise. Offering: GitLab.com, Self-managed, GitLab Dedicated Status: Experiment
- Introduced in GitLab 16.2 as an experiment.
Improve your planning and decision-making by predicting productivity metrics and identifying anomalies across your software development lifecycle.
Prerequisites:
- You must belong to at least one group with the experiment and beta features setting enabled.
- You must have permission to view the CI/CD analytics.
To view a forecast of deployment frequency in CI/CD Analytics:
- On the left sidebar, select Search or go to and find your project.
- Select Analyze > CI/CD analytics.
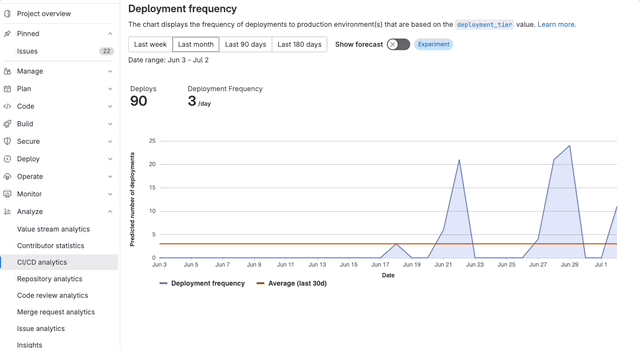
- Select the Deployment frequency tab.
- Turn on the Show forecast toggle.
- On the confirmation dialog, select Accept testing terms.
The forecast is displayed as a dotted line on the chart. Data is forecasted for a duration that is half of the selected date range.
For example, if you select a 30-day range, a forecast for the following 15 days is displayed.
Provide feedback on this experimental feature in issue 416833.
Populate an issue with Issue Description Generation
DETAILS: Tier: For a limited time, Ultimate. In the future, Ultimate with GitLab Duo Enterprise. Offering: GitLab.com Status: Experiment
- Introduced in GitLab 16.3 as an experiment.
Generate a detailed description for an issue based on a short summary you provide.
Prerequisites:
- You must belong to at least one group with the experiment and beta features setting enabled.
- You must have permission to view the issue.
- Only available for the plain text editor.
To generate an issue description:
- Create a new issue.
- Above the Description field, select GitLab Duo ({tanuki-ai}) > Generate issue description.
- Write a short description and select Submit.
The issue description is replaced with AI-generated text.
Provide feedback on this experimental feature in issue 409844.
Data usage: When you use this feature, the text you enter is sent to the large language model listed on the GitLab Duo page.