Tutorial: Use GitLab Observability with a NodeJS application
FLAG: The availability of this feature is controlled by a feature flag. For more information, see the history of the Distributed tracing feature.
In this tutorial, you'll learn how to configure, instrument, and monitor a NodeJS application using GitLab Observability features.
Before you begin
Take a moment and make sure you have the following:
- A GitLab Ultimate subscription for GitLab.com or GitLab self-managed
- A local installation of NodeJS
- Basic knowledge of Git, NodeJS, JavaScript, and the core concepts of OpenTelemetry
Create a new GitLab project
First, create a new GitLab project and a corresponding access token.
This tutorial uses the project name nodejs-O11y-tutorial.
- On the left sidebar, at the top, select Create new ({plus}) and New project/repository.
- Select Create from template.
- Select Use template for NodeJS Express.
- Enter the project details.
- In the Project name field, enter
nodejs-O11y-tutorial.
- In the Project name field, enter
- Select Create project.
- In the
nodejs-O11y-tutorialproject, on the left sidebar, select Settings > Access tokens. - Create an access token with the
apiscope and Developer role. Store the token value somewhere safe—you'll need it later.
Instrument your NodeJS application
Next, we need to instrument the NodeJS application.
-
Ensure you have NodeJS installed by running the following:
node -v -
Clone the
nodejs-O11y-tutorialproject andcdto thenodejs-O11y-tutorialdirectory. -
Install the dependencies by running:
npm install -
Run the application:
PORT=8080 node server.js -
In a web browser, visit
http://localhost:8080and make sure the application is running correctly. -
Add the OpenTelemetry packages:
npm install --save @opentelemetry/api \ @opentelemetry/auto-instrumentations-node -
Find your project ID:
- On the
nodejs-O11y-tutorialproject overview page, in the upper-right corner, select Actions ({ellipsis_v}). - Select Copy project ID. Save the copied ID for later.
- On the
-
Configure and run your project with instrumentation:
env OTEL_TRACES_EXPORTER="otlphttp" \
OTEL_EXPORTER_OTLP_ENDPOINT="https://gitlab.com/api/v4/projects/{{PROJECT_ID}}/observability" \
OTEL_EXPORTER_OTLP_HEADERS="PRIVATE-TOKEN={{ACCESS_TOKEN}}" \
OTEL_SERVICE_NAME="nodejs-O11y-tutorial" \
OTEL_LOG_LEVEL="debug" \
NODE_OPTIONS="--require @opentelemetry/auto-instrumentations-node/register" \
PORT=8080 node server.js
Be sure to replace the
PROJECT_ID, andACCESS_TOKENwith the values you obtained earlier. If using a self-managed GitLab instance, replacegitlab.comwith your self-managed instance hostname.
View traces
Now that you have an application configured to use Observability tracing, you can view exported traces on GitLab.com.
To view exported traces:
-
Start the
nodejs-O11y-tutorialapplication with instrumentation again. -
Visit
http://localhost:8080/and perform some actions in the application. -
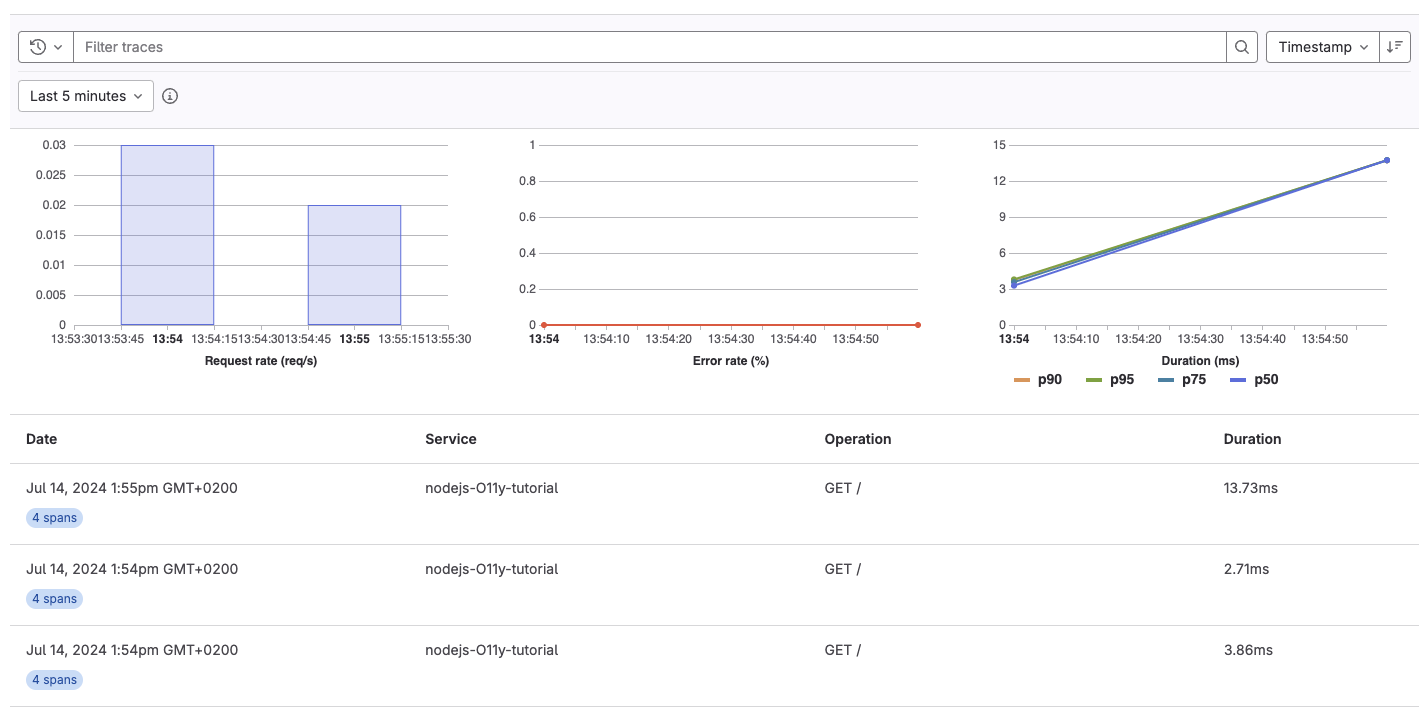
In the
nodejs-O11y-tutorialproject, on the left sidebar, select Monitor > Traces. If everything is working correctly, you should see a trace for each request.
-
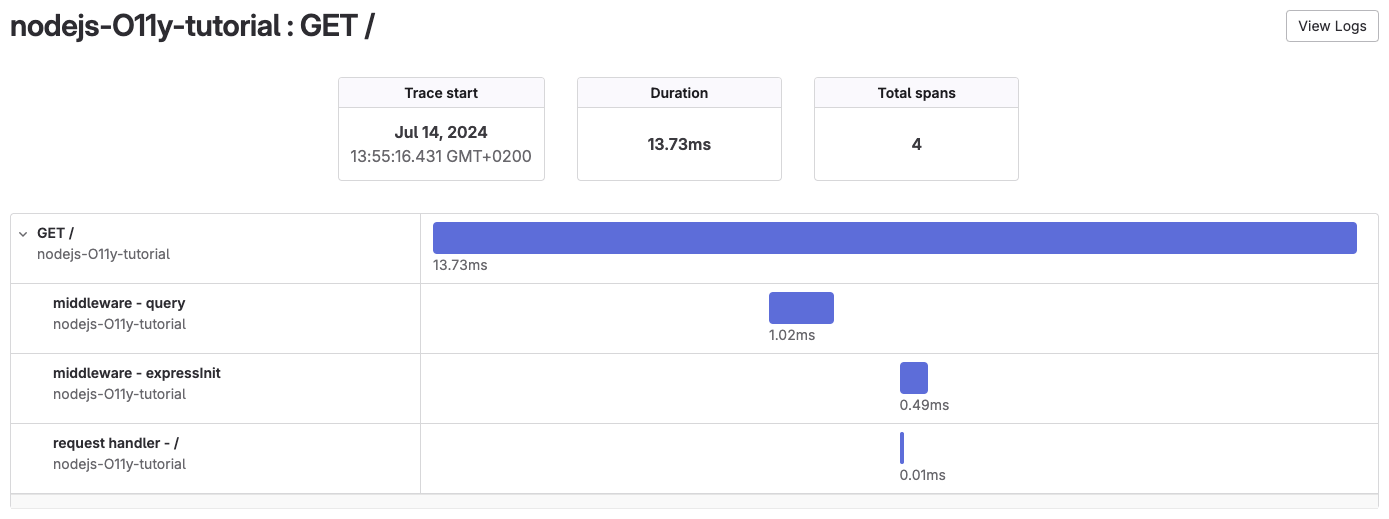
Optional. Select a trace to view its span.
Congratulations! You successfully created an application, configured it to use GitLab Observability features, and examined the traces the application created. You can continue to experiment with this application, or try configuring a more complex application to export traces.
Remember that Observability Tracing is not yet ready for production use. There is no official support for logs or metrics using the OpenTelemetry collector with a NodeJS application.